Simulation of Lake Level Declines in
Lake Huron ~11,000-10,000 Years Ago
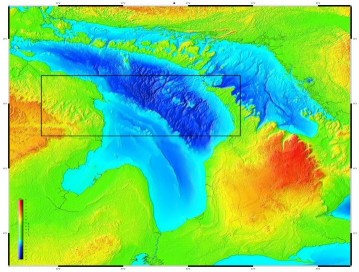
Map at left shows the Huron Ridge area (black rectangle) of Lake Huron at present lake levels. The animated maps below simulate the lake bottom exposed by each 5 meter (16 ft.) drop in lake level.
Although this simulation ends at the -100 meter level, actual lake levels may have fallen below -120 meters (-400 ft.), and remained at such low levels for centuries.
On each frame of the animation, the circled number below represents the change relative to the present lake level. The olive green areas (arrows) represent lake bottom exposed at the lower level. Note that at the -55 m level, the Huron Ridge forms a land bridge across the lake.